

Democracy, as Far as It Goes
It's very easy for Texas politicians to represent the people who elect them without necessarily representing the people of the state. The answer to that depends on whether the people doing the voting represent the people who live in the state and don’t vote. And the latter group is a lot bigger than the former.
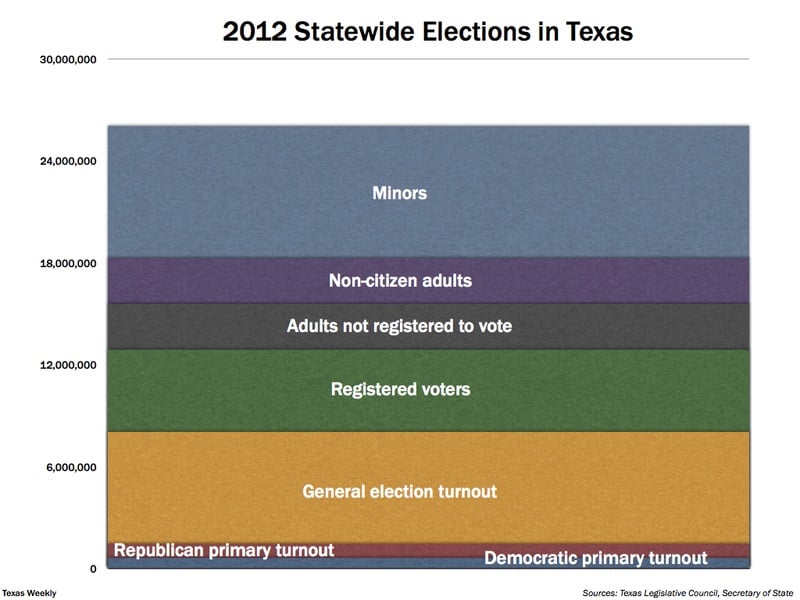
The math is simple, and the numbers are readily available from the Texas Legislative Council and the Texas secretary of state. In 2012, Texas had 26.1 million residents, a voting age population of 18.3 million, a citizen voting age population of 15.6 million and 13.6 million registered voters. Just under 8 million people voted in the November general election; 1.5 million voted in the Republican primary, and 657,833 voted in the Democratic primary.
In congressional and legislative elections in particular, the number of people who vote in primaries is critical. Only a handful of those districts is competitive in November elections, thanks to the strength of political redistricting efforts designed to carve the state into distinctly Republican and Democratic territories. That takes most of those elections out of the hands of general election voters, who greatly outnumber their counterparts in the party primaries.
We’ve charted the 2012 turnout and population numbers — by district — in for the congressional and legislative elections to illustrate the vast difference between residing and voting in Texas.
The charts are built from numbers for population, voting age population and citizen voting age population, all of which come from U.S. census counts and estimates, broken down into political districts by the TLC. Numbers for election turnouts and voter registration are generated by the secretary of state, again broken down into district numbers by the TLC. The numbers reflect the districts drawn by federal judges and actually used in the 2012 elections. The chart above shows the statewide numbers; the charts below, the variation across political districts.
Senate districts are allowed to vary a small amount in overall size, which explains the jagged line for total population.

Congressional districts are designed to be exactly the same size; thus the straight line for total population of each district. There are two Greens, both from Houston, both Democrats: Al is the one on the left and Gene is the one on the right in the chart below. And there are two Johnsons: Sam, R-Plano, is on the left and Eddie Bernice, D-Dallas, is on the right.

With 150 seats, there isn't room to label each House district. Instead, we bunched the districts around each set of numbers (population, VAP, CVAP, etc.) to illustrate the difference between the number of Texas, to the left, and the number of Texans who vote in primary elections, to the far right. In 2012, less than 12 percent of the voting age population turned out for the Republican and Democratic primary elections.

=============